
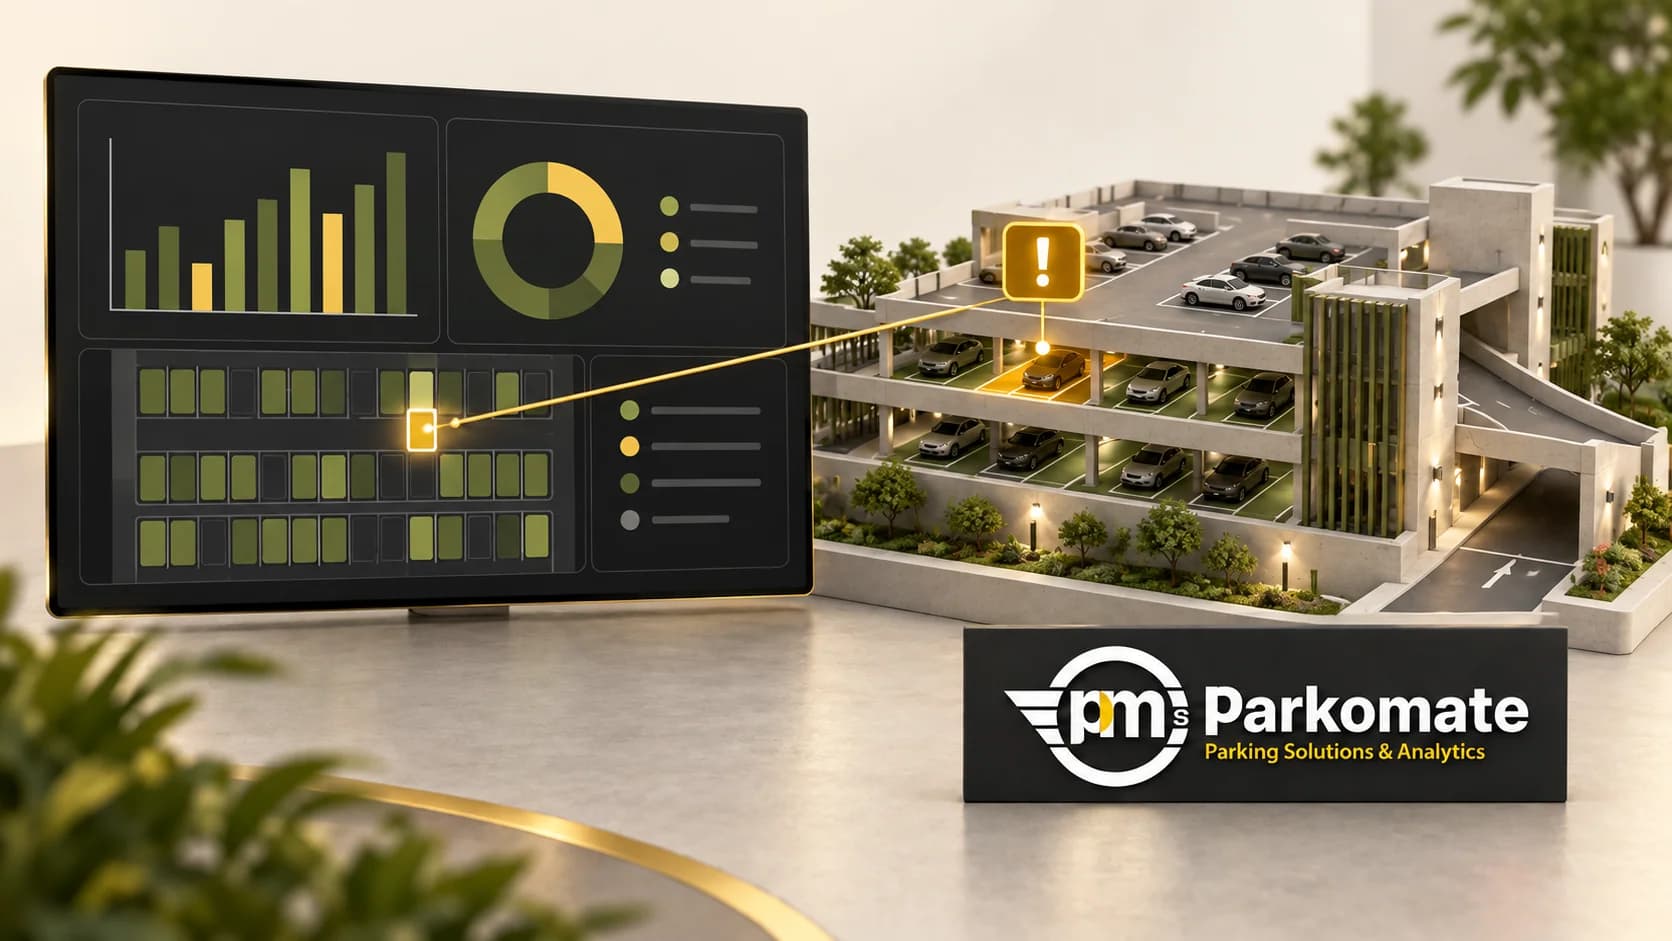
The dashboard says 80% occupied. The supervisor says ten bays are closed for work. Finance asks whether today's figure can be compared with last month's. Before discussing a target, the team needs to agree what the percentage counts.
Useful parking KPIs connect a defined measurement to a decision. Start with a few measures your facility can explain and act on. A chart with unclear boundaries can make a confident-looking report harder to use.
Occupancy: count the same capacity
For a snapshot, divide occupied usable bays by total usable bays in the same zone at the same time, then multiply by 100.
For illustration, 72 occupied bays out of 90 usable bays gives 80%. If the marked plan contains 100 bays but ten are closed, dividing by 100 answers a different question. Record the closure and keep the denominator visible.
For a period, occupied bay-minutes divided by available bay-minutes measures time-based occupancy. If you use an average of periodic snapshots instead, label it as an approximation. Keep the busiest interval visible alongside the daily average.
The FHWA's parking-pricing primer discusses management approaches suited to local conditions. Its US street-parking examples are context, not occupancy targets to copy into an Indian hospital, office basement or mall.
Session duration: name the start and finish
Entry-to-exit time includes circulation and any exit queue. Time occupying a bay measures something else. State which timestamps your system records before comparing reports.
Look at typical stays and the longer end of the range. Where the data supports it, separate staff, tenants and customers. A report containing only visits completed today can leave still-parked overnight vehicles out of the picture.
Use duration to investigate a question, such as whether an intended short-stay zone is occupied all day. Do not infer why someone stayed from the duration alone.
Turnover: count visits to the measured area
Define turnover as parking visits assigned to an area divided by its usable bays over a stated period. Decide whether you count arrivals or completed visits and keep that convention consistent.
In an arithmetic example, 180 completed visits across 60 usable bays gives three visits per bay for the day. That is not a benchmark. The same figure has different implications for an office allocation and a retail short-stay zone.
Gate counts do not automatically tell you which floor a vehicle used. Request floor-level reporting only where the installed data can support that assignment. Document how a capacity change affects the calculation.
Queue time: observe the waiting, not just the terminal
Choose a visible start, such as joining the recognised queue, and a finish, such as passing the gate. Record the lane, time window and measurement method. Manual observations are useful where the installed system does not directly measure the queue.
A quick payment interaction does not prove a short wait if cars are queued upstream. Compare similar periods and separate events from ordinary operation before proposing a staffing or layout change.
Exceptions: show what needs attention
Track manual overrides, incomplete sessions, payment issues and devices that stop reporting. Give each category an owner. Staff should be encouraged to record a problem accurately rather than improve a chart by leaving it out.
Unavailable data is not zero occupancy. Ask how a disconnected device appears on the live screen and in an export. The report should identify missing intervals and any estimated values.
Before accepting a dashboard, trace a small sample from an observed vehicle event to its live record and export. Check identifiers, timestamps, timezone and duplicate handling. This is more useful than deciding whether the chart looks plausible.
Turn the report into one manageable change
Choose a question, inspect comparable periods and agree a limited action. Record what changed and when so the next review can test the explanation.
Parking Analytics provides live views, trends, hardware status and exports in Parkomate's published product scope. The Mumbai commercial-tower deployment offers a relevant parking-guidance context for discussing availability. Its page is not evidence that a particular analytics dashboard was installed there; specify your required reporting separately.
Is higher occupancy always better? The useful balance depends on availability, entitlement and the purpose of each zone.
Can gate counts replace bay detection? They support movement measures, but cannot automatically locate every vehicle inside the facility.
Bring a sample report and the decision it should support to a dashboard discussion. That gives the demo a clear purpose.