
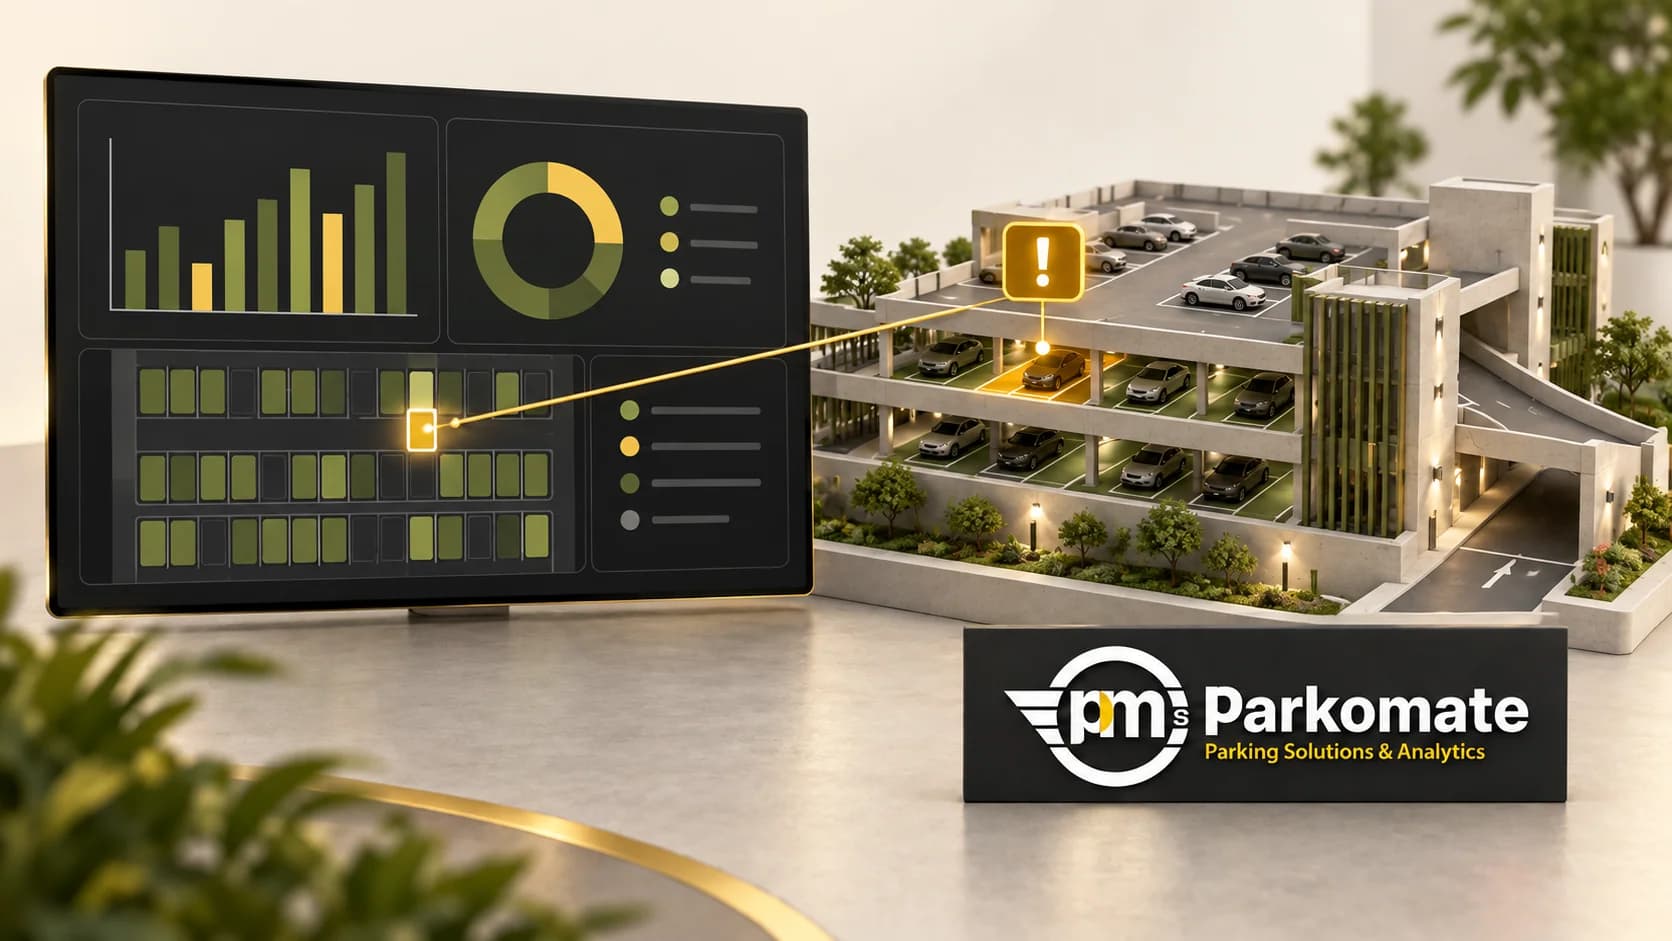
An occupancy map changes colour. A sensor warning appears. A monthly report shows a busy floor. Each is useful only if someone knows what to do next. Buying parking analytics software starts with those decisions, not the number of charts on the opening screen.
Parkomate's Parking Analytics product describes live maps, occupancy trends, session reports, hardware alerts and exports. The right demo connects those views to a facility question and shows where the information comes from.
Give each view a user and a question
The shift supervisor may need to know which zone requires attention now. The facility manager may want to compare demand across weekdays. Finance may need revenue or audit exports where billing is enabled. They do not necessarily need the same opening screen or access to every record.
Write one question for each role. For example: which parking area is under pressure during the morning arrival period, and is the data complete enough to trust that view? Ask the supplier to answer using a sample dataset with the same kinds of zones and events as your facility.
Check the level of detail the hardware supports
A gate count, a zone total and an individual bay state are different observations. The published Parkomate product page makes bay-level display conditional on bay-level detection through cameras or sensors. Do not assume a map can locate every car simply because the site has an entry counter.
List the data sources included in your proposal: parking guidance, ANPR, PMS or other agreed equipment. Ask which view each source supports and what detail will be unavailable.
For context, our Mumbai commercial-tower page describes parking guidance for basement availability and wayfinding. It is a useful place to start a conversation about availability information, without assuming that every analytics feature was installed at that property.
Make unavailable data visible
Ask for a controlled demonstration of a device that stops reporting. Does its last value remain visible? Is it clearly marked as stale? Can the supervisor identify the affected area and the time of the last update?
The same distinction should survive an export. Zero occupied bays and unavailable occupancy data lead to different decisions. If the report estimates a value, ask how that estimate is identified and which periods it covers.
Do not judge this only from a normal operating screen. A missing-data example reveals how much the team can understand when equipment or connectivity needs attention.
Follow one event into the report
Choose a sample entry, exit or bay change and find it in the live view and export. Check the identifier, timestamp, timezone, category and measured area. Then ask how a correction appears later.
Agree definitions before comparing sites. The parking KPI guide explains occupancy denominators, session duration and turnover. This buying exercise goes one step further: prove that the proposed software produces those agreed measures from the installed data.
Parkomate lists report exports, with exact CSV or Excel format to be confirmed during implementation. Request a sample file early and let the people who will use it try their actual review process.
Give alerts a route to resolution
For each warning, identify who sees it, what they should inspect and when the issue is escalated. Ask how a repeated warning is presented and how the team distinguishes a new fault from one already being investigated. Confirm the proposed workflow rather than assuming an alert includes a complete service-ticket system.
Keep a separate list of maintenance responsibilities and support contacts in the site's operating instructions. The dashboard can expose an issue; the contract and team arrangements determine who responds.
Run one review cycle before adding more dashboards
Choose a limited operating question, record a change and compare relevant periods. If the facility changes a zone boundary or closes bays for work, retain that context with the report. A different denominator can resemble an improvement or decline even when driver behaviour has not changed.
Will analytics calculate revenue everywhere? Revenue and audit reporting depends on billing being enabled and the agreed data being available.
Does an API promise integration with our reporting platform? It provides a possible connection. Agree the fields, permissions, update frequency and responsibility for the integration in the project scope.
Bring one report, one recurring operational question and one example alert to a Parking Analytics discussion. They provide a practical test of whether the proposed dashboard will help your team act.